Key Takeaway
Data pays off at a decision, not on a dashboard. Pick one frequent decision, wire it to a source its owner already trusts, put the signal inside the tool where they work, and check one number at 60 days.
Most companies have more data than value. This article is for leaders who’ve funded a data program and can’t yet point to what it earned. The fix is small on purpose: one decision, one trusted source, and one number you can check in 60 days.
The warehouse is built. Pipelines run every night. Every team has dashboards, and the data team has been busy for two years. Then someone in a leadership meeting asks a simple question: which decision got faster because of all this, and what did it earn us?
The room goes quiet. Nobody doubts the data program did real work. Nobody can draw a straight line from it to revenue, cost or speed either.
IDC’s research for its 2026 AI & Data Summit series lands in the same place. Data quality, integration and accessibility are still the top barriers to getting business value out of AI. The data exists. It just doesn’t arrive where decisions get made, in a form people trust enough to act on.
Why do data programs stall before they pay off?
They get measured on coverage instead of decisions. Sources ingested, tables modeled and dashboards shipped are fair engineering milestones, but none of them tells you whether anything changed in the business.
Value shows up at a decision. A price gets approved. A renewal gets saved. A shipment gets rerouted. Someone, or something, acts differently because of the data, and a measurable outcome follows.
Between the dashboard and that decision sits a last mile that usually belongs to nobody. The data team owns the pipeline. The business team owns the decision. The work that connects them falls into the gap:
- Picking the trusted source when three systems disagree
- Getting the signal into the tool where the person actually works, not a separate BI tab
- Defining what action the data should trigger
- Recording what happened afterward, so anyone can tell whether it worked
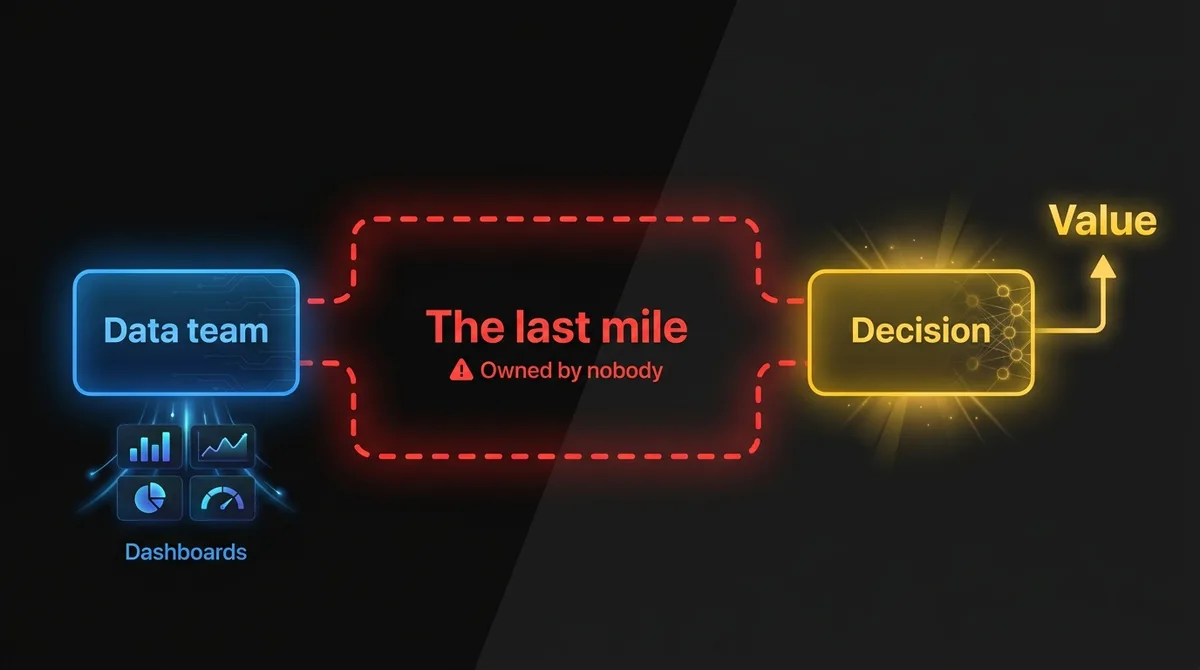
When nobody owns that work, it doesn’t get done. The dashboards keep refreshing. The decision keeps running on a spreadsheet and someone’s memory.
How can you tell your data isn’t reaching decisions?
Look for decisions that still depend on manual stitching, reports opened at the wrong moment, or an analyst’s inbox. We see some version of these four patterns at almost every company we work with. If they sound familiar, the data is probably fine. The last mile is the problem.
Spreadsheet stitching. Someone exports from the CRM, the billing system and the product database every week, joins them by hand, and sends the result to whoever makes the call. The data team may not know this spreadsheet exists.
Reports nobody opens at the right moment. Churn risk sits in a BI report. The account manager has the renewal call on Thursday. Those two facts never meet.
Decisions waiting on a data pull. Inventory, pricing or staffing calls slip by days because the person deciding has to ask an analyst for numbers.
Metrics with no owner. The dashboard shows a number moving. Nobody’s job depends on acting on it, so nobody does.
Each one is a decision made on fragmented data. Each one is also a contained problem you can fix.
Should you fix your data first or pick a decision first?
Pick the decision first. Cleaning everything and unifying the model before building any use case is why so many data programs are two years in with nothing to show the CFO. Start with an inventory of decisions and fix only the data each one needs.
List the recurring decisions in one part of the business: pricing exceptions, renewal prioritization, credit approvals, capacity planning, lead routing. Score each one on three factors.
| Factor | Question | Why it matters |
|---|---|---|
| Frequency | How often is this decision made? | Daily or weekly decisions compound. A quarterly one rarely justifies the build. |
| Value per decision | What’s at stake each time, in dollars or hours? | It caps what improving the decision can be worth. |
| Data readiness | Is there at least one source the decision owner already trusts? | If every source is disputed, you’ve got a data quality project, not a 60-day win. |
The best first candidate is frequent, carries real value, and has at least one trusted source. It’s rarely the most strategic decision in the company. That’s fine. The first project exists to prove the pattern and earn the budget for the second one.
What goes on a data-to-value canvas?
Seven fields, on one page, filled in before anyone writes code. We call it a data-to-value canvas:
- Decision. Stated plainly. “Which accounts get proactive outreach before renewal.”
- Owner. The person accountable for the outcome, by name. If you can’t name one, stop here.
- Current inputs. Where the information comes from today, spreadsheets included.
- Trusted source. The one system the owner will accept as truth for this decision.
- Action. What changes when the signal fires. A task gets created, an approval gets routed, a price gets suggested.
- Metric. The number that tells you it worked, with a baseline measured before you start.
- First milestone. What ships in the first 30 days.
The canvas does two jobs. It puts the business and technical sides in the same conversation, which is where the hidden disagreements surface. It also gives leadership something they can approve: a specific outcome, a cost and a date.
What does a data-to-value workflow actually include?
Five parts, and it’s usually narrower than people expect. You need ingestion from two or three sources, a decision layer, delivery into the tool where the decision happens, a human approval step, and outcome logging. None of it requires a new platform.
Ingestion from two or three sources. Not the whole warehouse. Pull only the fields the decision needs, from the systems on the canvas. If a model already exists in your warehouse, use it.
A decision layer. This is where the logic lives. It often starts as plain rules the owner can read and argue with. Add a predictive model or an LLM (large language model) where it clearly beats the rules, like scoring risk from many weak signals or summarizing support tickets and call notes. Version it and test it like any other service.
Delivery into the tool where the decision happens. The signal belongs in the CRM record, the approval queue, the Slack channel or the ERP screen. A separate dashboard is one more tab nobody opens. If people have to go looking for the insight, adoption drops fast.
A human in the loop, at first. The system recommends and a person approves. That builds trust and produces labeled data on when the recommendation was right. Expand automation once the approval rate is high and stable.
Outcome logging. Record every recommendation, what the person did, and what happened next. Most teams skip this part. It’s the only way to answer the leadership question with evidence.
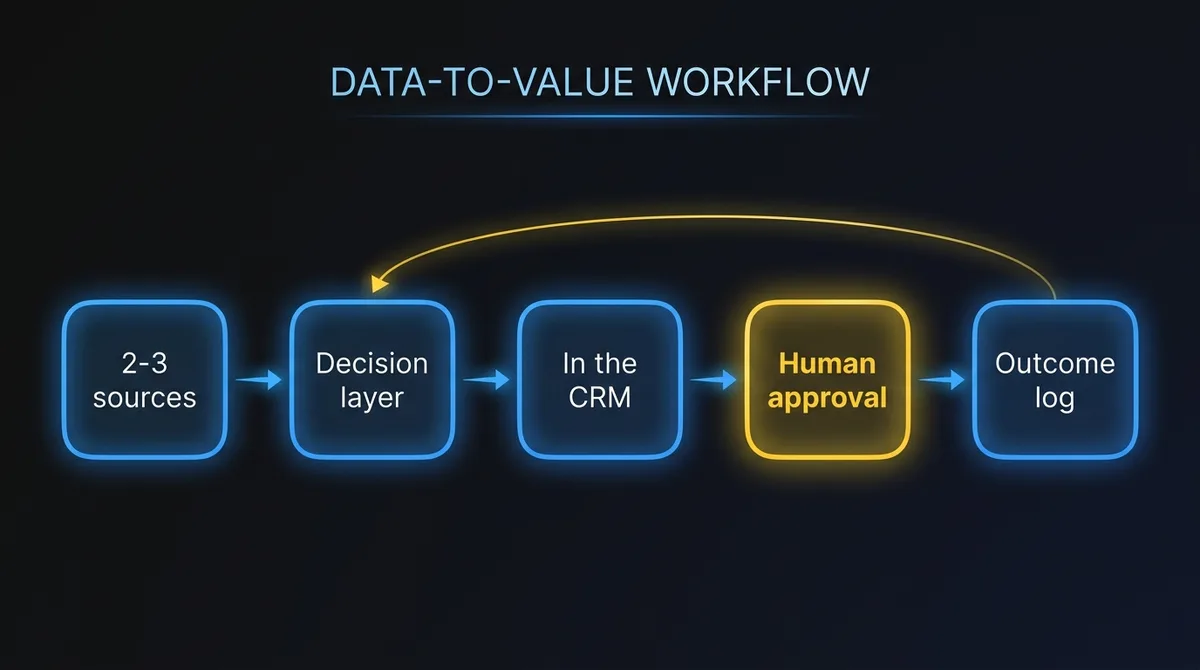
What it does need is engineers who can work across your data stack and your application layer, plus a decision owner who shows up every week.
What does this look like for renewal risk at a SaaS company?
A prioritized weekly list of at-risk accounts, sitting in the CRM, with a one-line reason next to each name. The numbers below are illustrative, but the structure carries over to most recurring decisions.
The decision: which accounts the customer success team contacts proactively in the 90 days before renewal.
Today: Account managers check a churn dashboard when they remember to. The real signal is scattered. Product usage lives in the analytics tool, support escalations in the help desk, billing issues in the finance system. Most at-risk accounts get noticed on the renewal call itself, when it’s too late.
The canvas:
- Owner: VP Customer Success
- Trusted sources: product usage events, help desk tickets, billing status
- Action: a prioritized weekly list in the CRM, with a short reason on each account (“usage down 40% over 6 weeks, two open escalations”)
- Metric: gross revenue retention on flagged accounts, against a baseline
- First milestone: risk list live in the CRM for one segment within 30 days
The math: Say the company has $20M in ARR (annual recurring revenue), $8M renews in a given half, and gross retention on that cohort runs at 88%. That’s $960K lost. If earlier outreach saves a fifth of it, that’s roughly $190K kept in six months, from a workflow built on data the company already had.
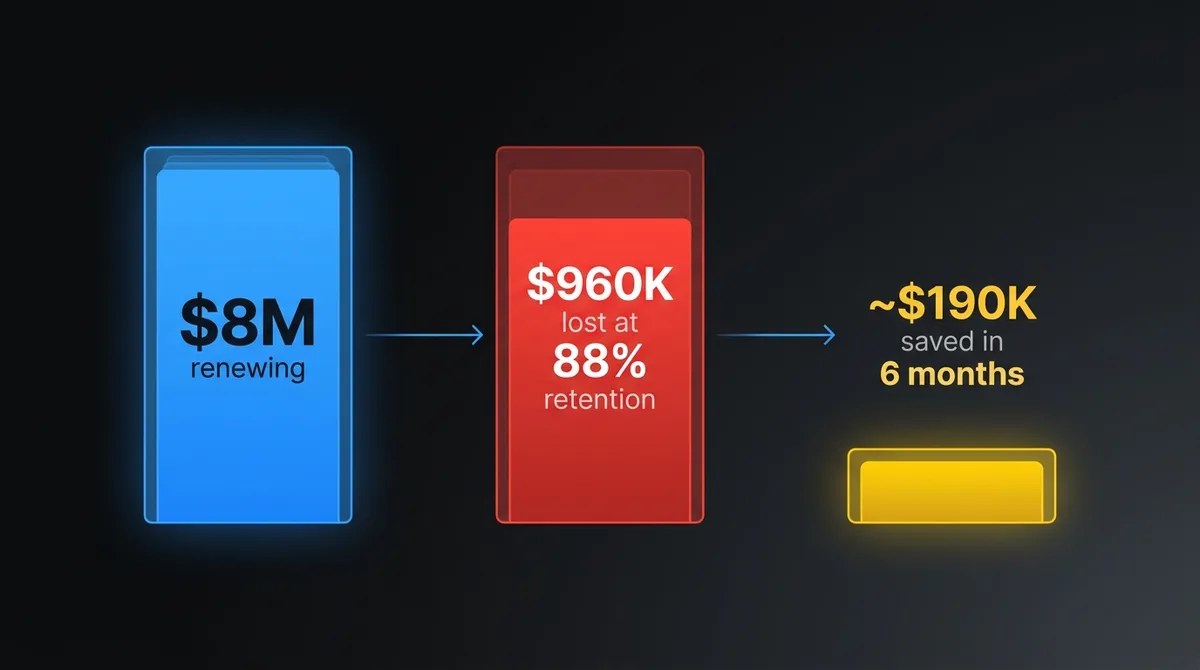
The model is rarely the hard part. The hard part is agreeing which usage events count as engagement, joining help desk data to the right account IDs, and getting account managers to work from the list. That’s last-mile work, and it’s where the value comes from.
For help framing this kind of math for a CFO, see how to build the business case for AI investment.
How should you measure whether a data project worked?
Take a baseline before you ship, track one leading and one lagging indicator, and set a 60-day checkpoint with a decision attached. Measurement is what separates a data-to-value project from another analytics initiative.
Baseline before you ship. If you don’t know today’s retention rate, approval time or forecast error, you can’t claim an improvement later. Pull the baseline in week one.
Track a leading indicator and a lagging one. Revenue retention takes a quarter to show up. Adoption shows up in days: what share of flagged accounts got contacted, and how fast. If adoption is low, the outcome won’t move, and you’ll know early.
Set a 60-day checkpoint with a real decision attached. At 60 days you expand to the next segment, adjust the logic, or stop. Write down in advance which result triggers which option.
For more on telling useful metrics from flattering ones, see AI feature KPIs that actually tell you something.
Where does AI fit in turning data into decisions?
In the decision layer, after the data is trusted. LLMs can read support tickets, call notes and contract terms that scoring models used to ignore. Agents can carry out the action instead of only recommending it.
But AI amplifies whatever you feed it. An agent working from untrusted data doesn’t fail quietly. It sends the wrong email, applies the wrong discount or reroutes the wrong order, at scale. So the order matters: trusted source first, human-approved recommendations second, automation once the record shows it works.
Companies that jump to agents on top of fragmented data get impressive demos and a pilot that never reaches production. We’ve covered that pattern in AI strategy for scale-ups: moving from pilot to production.
Who needs to be on a data-to-value project?
Three people: the decision owner, a data engineer and a product-minded engineer. That’s fewer than most data initiatives, but each one has to be the right person.
- The decision owner, every week. Not a delegate. They define “trusted,” approve the action, and drive adoption with their team.
- A data engineer who knows your sources and can keep the right fields joined and fresh.
- A product-minded engineer who can build the decision layer and get it into the tools people already use.
Most companies have the decision owner and some data engineering capacity. The usual gap is the third role: someone who works across the data stack and the application layer and treats the workflow as a product, not a report. That’s the role we fill. Our engineers embed with your team, work in your stack, and ship the first workflow to production alongside your people, so the capability stays after we leave.
Frequently Asked Questions
How long does it take to see ROI from a data project?
A single-decision project should show adoption within a few weeks and a measurable outcome by the 60-day checkpoint. Lagging metrics like revenue retention can take a full quarter, which is why you track a leading indicator alongside them.
Do we need a data warehouse before we can start?
No. The first workflow pulls only the fields one decision needs from two or three systems. If you already have a warehouse model that covers those fields, use it. If not, a targeted pipeline is enough.
Should we use AI agents or rules for the decision layer?
Start with rules the decision owner can read and challenge. Add a predictive model or an LLM where it clearly beats the rules, and only automate the action once human approval rates are high and stable.
Which decision should you start with?
The one your team makes every week on fragmented data. You don’t need a new data strategy to get value from the data you already have. You need one decision, mapped honestly, wired to a source the owner trusts, with a number you’ll check in 60 days.
If you want help mapping it, we run 20-minute data-to-value sessions. We work through one decision, the data behind it and what changes if it works. You leave with a proposed first milestone. Book a data-to-value session.