Key Takeaway
Standard APM gives you a green dashboard while your agent gives customers bad answers. Production agent monitoring requires tracking hallucination drift, tool-call loops, context exhaustion, and cost burn rate with purpose-built observability tools like Langfuse or LangSmith.
Your agent shipped. It passed evals. It handled the demo without embarrassing anyone. The product team is happy. Engineering is cautiously optimistic.
Six weeks later, a customer reports that the agent recommended deleting a production database index. The logs show a clean 200 response with 340ms latency. By every traditional metric, nothing went wrong. But something very clearly did.
Monitoring AI agents in production requires a different mental model than monitoring traditional software. The failure modes are different. The signals are different. The tools you already have cover about 30% of what you need.
Why does traditional APM fall short for AI agents?
Datadog, New Relic, and similar platforms are built around a well-understood model: requests come in, processing happens, responses go out. You track latency percentiles, error rates, throughput, and resource utilization. When something breaks, it shows up as an elevated error rate or a latency spike.
AI agents break this model in a specific way. An agent can return a successful HTTP response, within normal latency bounds, with a well-formed JSON payload, and the content of that payload can be completely wrong. The agent hallucinated a tool parameter. It made a decision based on context from three turns ago that was no longer relevant. It called the same API four times because it couldn’t parse the response correctly.
None of these show up in your APM dashboard. The request succeeded. The latency was fine. The error rate didn’t move. Your traditional monitoring stack gives you a green dashboard while your agent gives a customer bad advice.
This doesn’t mean you throw away APM. You still need it for infrastructure health, API availability, and baseline performance tracking. But it becomes the floor, not the ceiling.
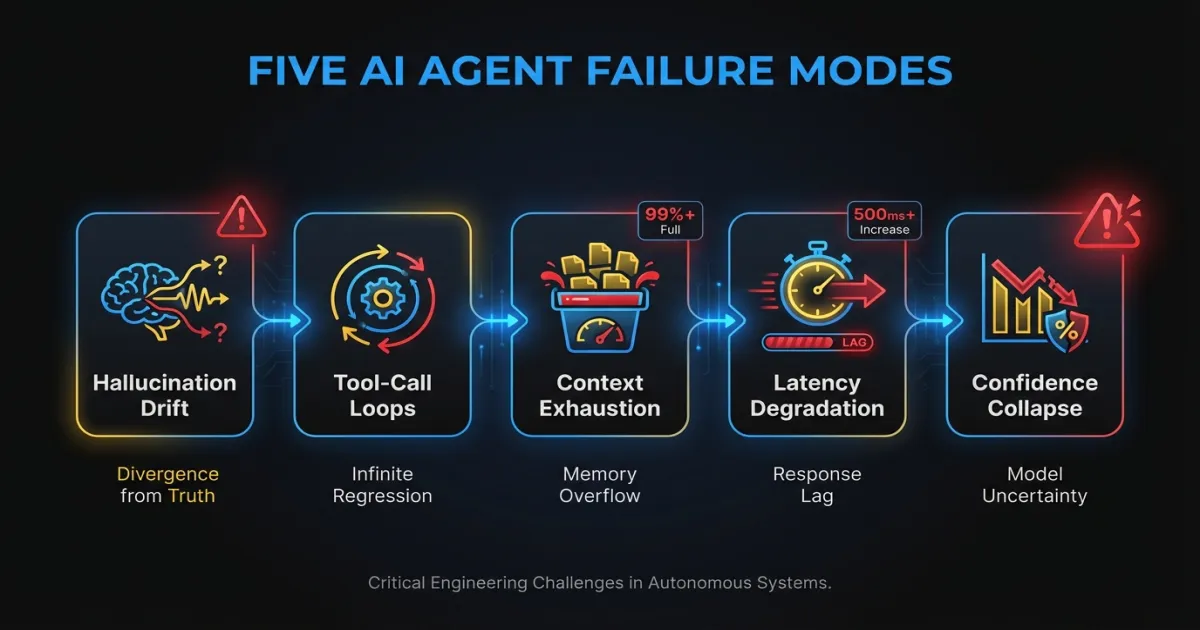
What are the five failure modes worth monitoring?
After operating agent systems across multiple production deployments, these are the failure patterns that cause real damage. They share a common trait: they’re invisible to standard monitoring.
Hallucination drift
Hallucinations aren’t a binary. An agent doesn’t suddenly start making things up. It drifts. Output quality degrades gradually as context accumulates in long conversations, as model providers push silent updates, or as the distribution of production inputs shifts away from what your eval suite covers.
Week one, the agent gets 94% of responses factually correct. Week six, it’s at 87%. Nobody notices because there’s no metric tracking it. The degradation only surfaces when a customer escalates or when someone manually spot-checks outputs.
Monitoring this requires running continuous evaluation against production traffic. Sample 5-10% of responses, run them through a scoring pipeline, and track the trend. A 3-point drop over two weeks is a signal worth investigating even if no individual response triggered an alert.
Tool-call loops
An agent that can call external tools will sometimes get stuck. It calls the search API, gets results it can’t parse, rephrases the query, gets similar results, rephrases again, and repeats. Each individual tool call succeeds. The agent is “working.” But it’s burning tokens and time without making progress.
In one system we observed, an agent averaged 3.2 tool calls per request during normal operation. Over a weekend, a third-party API changed its response format slightly. Monday morning, the average was 11.4 tool calls per request. Latency tripled. Costs quadrupled. The error rate stayed at zero.
Track tool calls per request as a distribution, not just an average. Alert when the 95th percentile exceeds 2x the trailing 7-day baseline.
Context window exhaustion
Every LLM has a finite context window. When an agent’s accumulated context (system prompt, conversation history, tool results, retrieved documents) approaches that limit, the model starts dropping information. It doesn’t error. It doesn’t warn you. It silently truncates, and the agent loses access to instructions or context it needs to make good decisions.
This is especially dangerous in multi-turn conversations and agentic AI use cases where the agent accumulates tool results over many steps. A RAG-augmented agent that retrieves four documents per turn can exhaust a 128K context window in under 20 turns.
Log token usage at every step. Track the ratio of used tokens to the model’s context limit. Alert when any request exceeds 80% of the window. Consider this a design problem, not just a monitoring problem. If you’re regularly hitting 80%, your context management strategy needs work.
Latency degradation from sequential dependencies
A simple API call takes 200ms. An agent that reasons, calls a tool, reads the result, reasons again, calls another tool, and synthesizes a response chains five or six sequential operations. Each one takes 200-2000ms depending on model inference time, tool response time, and RAG retrieval speed.
The end-to-end latency for a single agent request can easily reach 8-15 seconds. And it’s variable. A cold model queue adds 2 seconds. A slow vector database query adds another second. These compound unpredictably.
Track latency per step, not just end-to-end. Instrument each reasoning step, each tool call, and each retrieval operation with its own span. This is where OpenTelemetry traces pay for themselves: you can see exactly which step in a 12-second request took 6 seconds.
Confidence collapse
Some agents produce confidence scores or can be prompted to express uncertainty. The dangerous pattern is when the agent generates low-confidence outputs but acts on them anyway. It’s “not sure” whether the user is asking about billing or account deletion, but it proceeds with the billing interpretation and executes a refund.
If your agent architecture includes any form of confidence scoring, track the distribution of confidence scores over time. A leftward shift (more low-confidence responses) often precedes a spike in user complaints by 1-2 weeks. It’s a leading indicator that something in the input distribution or model behavior has changed.
What should you log and trace in an AI agent system?
The default instinct is to log inputs and outputs. That captures maybe 20% of what you need to debug a production agent issue. The reasoning chain between input and output is where problems actually live.
For each agent request, capture:
The full reasoning chain. Every intermediate thought or planning step the agent produces. When an agent makes a bad decision, the reasoning chain shows you where the logic went wrong. Without it, you’re guessing.
Tool-call sequences with timing. Which tools were called, in what order, with what parameters, what they returned, and how long each took. This is the single most useful debugging artifact for agent systems. When you can see that the agent called the search tool three times with nearly identical queries, the problem is obvious. Without the sequence, you’d spend hours reproducing it.
Token usage per step. Not just total tokens per request. Tokens consumed at each step of the reasoning chain. This tells you where context is accumulating and where cost is concentrated.
Retrieval results and relevance scores. If your agent uses RAG, log what was retrieved and any relevance or similarity scores. Bad retrieval is the root cause of a large percentage of agent failures. If the agent gets irrelevant documents, its downstream reasoning will be wrong no matter how good the model is.
Decision points. When the agent chose between multiple options (which tool to call, which approach to take, whether to ask for clarification), log the alternatives it considered and why it chose what it chose. This is the hardest data to capture but the most valuable for understanding systematic biases in agent behavior.
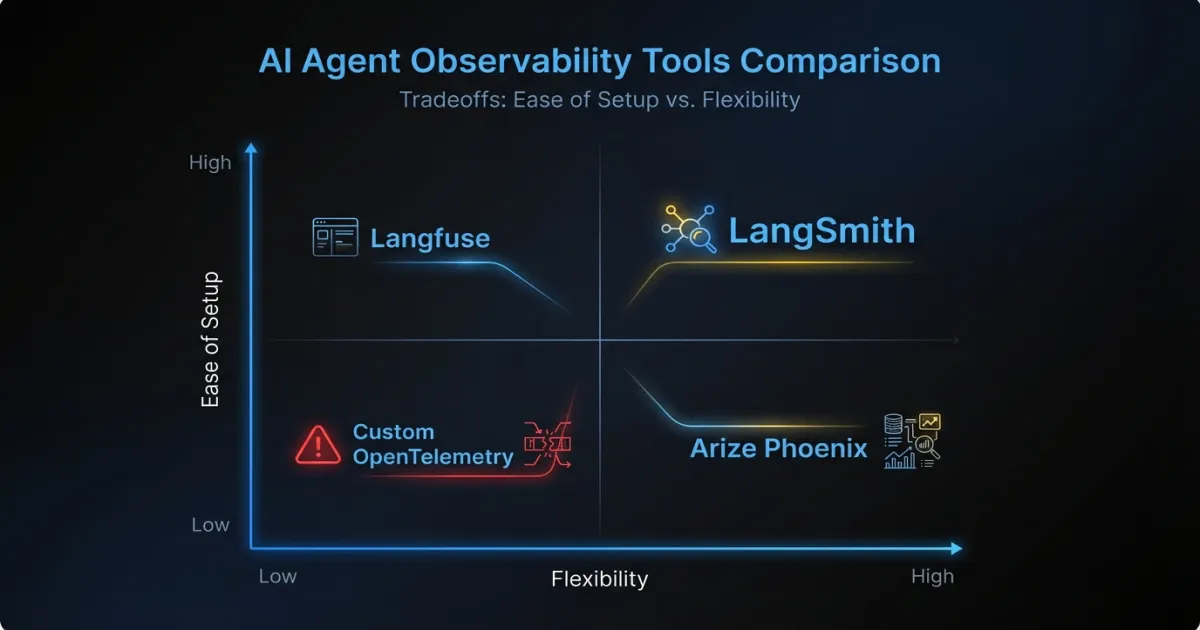
Which observability tools work best for AI agents?
The tooling landscape for LLM observability has matured rapidly. Here’s an honest assessment of the main options.
LangSmith works well if you’re already in the LangChain ecosystem. The trace visualization is good, and the integration is nearly zero-effort if you’re using LangChain or LangGraph. The limitation is vendor lock-in: if you move away from LangChain (and many custom AI agent projects do), LangSmith becomes harder to justify. Pricing scales with trace volume, which gets expensive at high throughput.
Langfuse is the open-source alternative that’s gained serious traction. You can self-host it, which matters for teams with data residency requirements or cost sensitivity. The tracing model is framework-agnostic, so it works with custom agent architectures. The trade-off is operational overhead: you’re running another service, and the self-hosted version requires PostgreSQL and maintenance.
Arize Phoenix focuses on evaluation and drift detection. It’s strong for tracking output quality over time and detecting distribution shifts in embeddings or model behavior. Less focused on real-time operational monitoring, more on understanding trends. Works well as a complement to a tracing tool rather than a replacement.
Custom OpenTelemetry instrumentation is what teams with existing observability infrastructure often land on. You add spans and attributes to your existing tracing pipeline, send them to whatever backend you already use (Jaeger, Tempo, Honeycomb), and build dashboards in your existing tools. The upside is no new vendors and full control. The downside is significant engineering investment to build the LLM-specific features (token tracking, prompt rendering, evaluation pipelines) that purpose-built tools include out of the box.
For most teams, the practical path is starting with Langfuse or LangSmith for agent-specific tracing and keeping your existing APM stack for infrastructure monitoring. If you’re operating enterprise AI agent systems at scale and have strong platform engineering, custom OTel instrumentation gives you more flexibility long-term.
What alerting strategies actually work for AI agents?
The instinct is to set up threshold alerts on everything and tune from there. This produces alert fatigue within a week. Agent systems are inherently variable, and static thresholds trigger on normal variance.
Start with these four alert categories:
Hard thresholds on cost and tokens. Set a per-request cost ceiling and a per-request token ceiling. These should be generous enough to avoid false positives (3-5x the median) but tight enough to catch runaway loops. A tool-call loop that burns $2 per request instead of the normal $0.15 should page someone.
Anomaly detection on output similarity. Track the semantic similarity of agent outputs for similar inputs over time. When outputs start drifting (lower similarity scores for inputs that should produce consistent responses), something has changed. This catches hallucination drift, model provider updates, and retrieval quality degradation.
Escalation triggers for low-confidence actions. If your agent can assess its own confidence, route low-confidence actions to a human review queue instead of executing them. This isn’t technically an alert, but it functions as one: a spike in human-review escalations tells you the agent is struggling with a new class of inputs.
Cost burn rate alerts. Track hourly and daily spending on model inference. Alert when the burn rate exceeds 150% of the trailing 7-day average. This catches both runaway loops and organic traffic spikes that might push you past budget before the month ends.
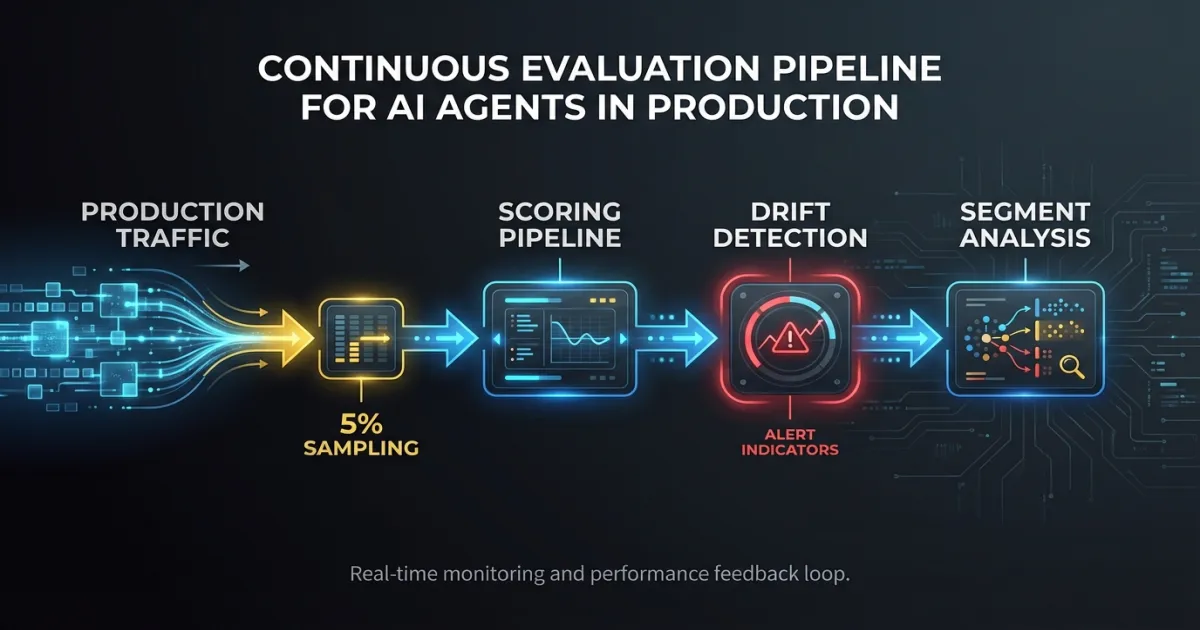
How should you use evaluation as ongoing monitoring?
Most teams run evaluations before deployment and stop there. The model passes the eval suite, it ships, and nobody checks again until something breaks. This misses the fundamental reality of LLM-based systems: they change without you changing anything. Model providers update weights. Your production input distribution shifts. Retrieved documents get stale.
Run your eval suite on production traffic continuously. Sample a percentage of requests (5% is usually enough to catch trends without significant cost), run them through your scoring pipeline, and track scores over time. The eval suite you used before deployment becomes a monitoring tool in production.
Track three things:
Absolute scores per eval dimension. Accuracy, relevance, safety, format compliance. Whatever you measure pre-deployment, keep measuring in production.
Score drift over time. A gradual decline in any dimension is a signal. Set alerts for statistically significant drops over a rolling window.
Segment-level performance. Aggregate scores hide problems. An agent might score 92% overall while scoring 65% on a specific input category that represents 8% of traffic. Break scores down by input type, user segment, or task category.
When you’re running multiple versions of an agent (A/B testing new prompts, evaluating a model upgrade), this production eval pipeline lets you compare versions on real traffic. Not synthetic benchmarks. Not cherry-picked examples. Actual production inputs with statistical significance.
Where should you start if you have zero agent observability?
If your agent is in production today with no observability beyond basic APM, here are three things to instrument first. They cover the highest-value signals with the least effort.
First: request/response logging with trace IDs. Log the full input, output, and a unique trace ID for every agent request. Store them somewhere queryable (not just a log stream). This alone lets you investigate customer-reported issues by pulling the exact request and seeing what the agent did. Without this, you’re flying blind.
Second: tool-call success rates and counts per request. Instrument your tool-calling layer to emit metrics on which tools were called, whether they succeeded, and how many calls each request generated. This gives you early warning on tool-call loops and integration failures. It’s a few lines of instrumentation with outsized diagnostic value.
Third: cost per interaction. Track the token usage and estimated cost of every request. Aggregate by hour and day. Set a simple alert if daily cost exceeds 2x the trailing average. This is the metric that catches the widest variety of problems: loops, context bloat, model routing failures, and traffic spikes all show up in cost.
These three give you enough visibility to catch the most damaging failure modes. Add reasoning chain logging, retrieval instrumentation, and continuous evaluation as your observability practice matures.
Production AI systems fail differently than traditional software. The sooner your monitoring reflects that, the fewer 2 AM pages you’ll get about an agent that looked perfectly healthy while giving customers bad answers. The tools and patterns exist. The gap is in adoption. Most teams are still monitoring agents the same way they monitor CRUD APIs. That’s where the risk lives.
FAQ
What’s the difference between AI agent observability and traditional APM?
Traditional APM tracks HTTP status codes, latency, and error rates. AI agent observability adds layers on top: reasoning chain tracing, tool-call sequence logging, token usage tracking, hallucination drift detection, and output quality scoring. An agent can return a 200 OK with perfect latency and still give a completely wrong answer. Traditional APM won’t catch that.
How much does AI agent monitoring cost to implement?
Starting with basic request logging and tool-call metrics takes a few days of engineering effort using open-source tools like Langfuse. Self-hosting Langfuse costs roughly the same as running a small PostgreSQL instance. Purpose-built SaaS tools like LangSmith charge based on trace volume, typically $0.005-0.01 per trace. The bigger cost consideration is continuous evaluation, which requires sampling production traffic through a scoring model.
Can I use my existing Datadog or New Relic setup for AI agents?
Yes, as a foundation. Keep your existing APM for infrastructure health, API availability, and baseline performance. Then layer agent-specific tooling on top for reasoning traces, token tracking, and output quality scoring. Custom OpenTelemetry instrumentation can bridge the two, sending agent-specific spans to your existing backend while adding LLM-specific attributes.
If your team is building or operating AI agents in production and needs help setting up observability that actually catches the failures that matter, talk to our team about engineering support from people who’ve built and operated these systems at scale.